 اندیکاتور اتوماتیک تشخیص واگرایی
اندیکاتور اتوماتیک تشخیص واگرایی + ویدیو آموزشی
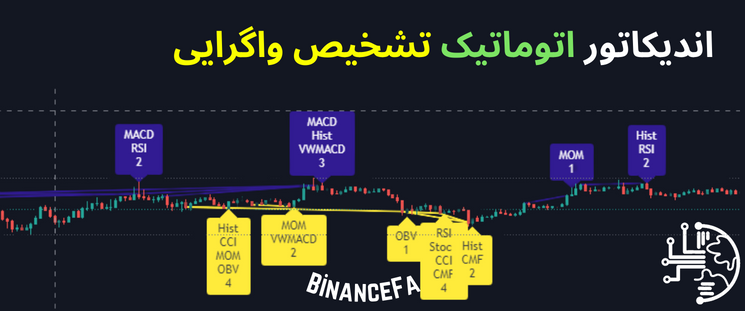
اندیکاتور اتوماتیک تشخیص واگرایی، تمام واگرایی ها را برای شما در چند ثانیه پیدا خواهد کرد. تنها با چند کلیک ساده می توانید هر واگرایی که روی چارت وجود دارد را مشاهده کنید و به تحلیل ارز دیجیتال بپردازید. در این ویدیو با نحوه کار این اندیکاتور آشنا خواهید شد. پس برای دریافت اطلاعات بیشتر، حتماً فیلم آموزش اندیکاتور واگرایی را به دقت مشاهده کنید تا همه واگرایی ها به صورت خودکار روی چارت قیمت به نمایش در بیایند.
اگر تشخیص خطوط حمایت و مقاومت برایتان دشوار است، در مطلب پیشین اندیکاتور اتوماتیک تشخیص خطوط حمایت و مقاومت را معرفی کردیم که حتماً باید آن را بشناسید؛ چون تغییراتی مهمی در تحلیل شما ایجاد خواهد کرد. اما به سراغ واگرایی ها می رویم. به طور کلی دو دسته واگرایی داریم که به آنها واگرایی معمولی و واگرایی مخفی گفته می شود. این اندیکاتور می تواند واگرایی های زیر را به شما نمایش دهد:
- واگرایی MACD
- واگرایی MACD Histogram
- واگرایی RSI
- واگرایی Stochastic
- واگرایی CCI
- واگرایی Momentum
- واگرایی OBV
- واگرایی VWmacd
- واگرایی Chaikin money flow
- واگرایی Money flow index
هر یک از واگرایی های بالا ویژگی و عملکرد متفوتی دارند. این indicator به طور دقیق نشان می دهد چند واگرایی با کمک یک دیگر توانسته اند روند قیمت را تغییر دهند و موجب نزولی یا صعودی شدن آن شوند. با استفاده از اندیکاتور تشخیص واگرایی می توانید تایم فریم های هفتگی تا روزانه و ساعتی و… را نیز بررسی کنید و تمام واگرایی های آنها را مشاهده کنید؛ همچنین تنظیمات این اندیکاتور برای همه معامله گران در دسترس بوده و امکان تغییر وجود دارد.
برای مشاهده اندیکاتور تشخیص واگرایی روی این لینک بزنید و طبق ویدیو پیش بروید. در مطلب بعدی قصد داریم اندیکاتور اتوماتیک تشخیص روند صعودی و نزولی را در بازار ارزهای دیجیتال به شما معرفی کنیم تا با استفاده از این اندیکاتور مسیر بازار را در دستتان بگیرید و طبق برنامه ترید خود پیش بروید. اندیکاتورها ابزارهایی هستند که کار را برای تریدر ساده تر می کنند و چه چیزی بهتر از این است که این ابزار به شکل خودکار موارد مورد نیاز تریدر را فراهم کنند.
کد اندیکاتور اتوماتیک تشخیص واگرایی قابل استفاده در تریدینگ ویو
// This source code is subject to the terms of the Mozilla Public License 2.0 at https://mozilla.org/MPL/2.0/

// © mrbtc-trade

//@version=5

indicator('Divergence All BinanceFA.com', overlay=true, max_bars_back=1000, max_lines_count=400, max_labels_count=400)

prd = input.int(defval=5, title='Pivot Period', minval=1, maxval=50)

source = input.string(defval='High/Low', title='Source for Pivot Points', options=['Close', 'High/Low'])

searchdiv = input.string(defval='Regular/Hidden', title='Divergence Type', options=['Regular', 'Hidden', 'Regular/Hidden'])

showindis ='Full'// input.string(defval='Full', title='Show Indicator Names', options=['Full', 'First Letter', 'Don\'t Show'])

// showlimit = input.int(1, title='Minimum Number of Divergence', minval=1, maxval=11)

maxpp = input.int(defval=10, title='Maximum Pivot Points to Check', minval=1, maxval=20)

maxbars = input.int(defval=100, title='Maximum Bars to Check', minval=30, maxval=200)

shownum =false// input(defval=true, title='Show Divergence Number')

showlast =false// input(defval=false, title='Show Only Last Divergence')

dontconfirm = input(defval=false, title='Don\'t Wait for Confirmation')

showlines = input(defval=true, title='Show Divergence Lines')

showpivot =false// input(defval=false, title='Show Pivot Points')
calcrsi =true// input(defval=true, title=’RSI’)
pos_reg_div_col = input(defval=#FFFF00, title='Positive Regular Divergence')

neg_reg_div_col = input(defval=#0000FF, title='Negative Regular Divergence')

pos_hid_div_col = input(defval=#00FF00, title='Positive Hidden Divergence')

neg_hid_div_col = input(defval=#ff0000, title='Negative Hidden Divergence')

pos_div_text_col =color.black// input(defval=color.black, title='Positive Divergence Text Color')

neg_div_text_col =color.white// input(defval=color.white, title='Negative Divergence Text Color')

reg_div_l_style_ ='Solid'// input.string(defval='Solid', title='Regular Divergence Line Style', options=['Solid', 'Dashed', 'Dotted'])

hid_div_l_style_ ='Dashed'// input.string(defval='Dashed', title='Hdden Divergence Line Style', options=['Solid', 'Dashed', 'Dotted'])

reg_div_l_width =2// input.int(defval=2, title='Regular Divergence Line Width', minval=1, maxval=5)

hid_div_l_width =1// input.int(defval=1, title='Hidden Divergence Line Width', minval=1, maxval=5)

// set line styles

var reg_div_l_style = reg_div_l_style_ == 'Solid' ? line.style_solid : reg_div_l_style_ == 'Dashed' ? line.style_dashed : line.style_dotted

var hid_div_l_style = hid_div_l_style_ == 'Solid' ? line.style_solid : hid_div_l_style_ == 'Dashed' ? line.style_dashed : line.style_dotted

// get indicators

rsi = ta.rsi(close, 14) // RSI

// keep indicators names and colors in arrays

var indicators_name = array.new_string(11)

var div_colors = array.new_color(4)

if barstate.isfirst

//colors

array.set(div_colors, 0, pos_reg_div_col)

array.set(div_colors, 1, neg_reg_div_col)

array.set(div_colors, 2, pos_hid_div_col)

array.set(div_colors, 3, neg_hid_div_col)

// Check if we get new Pivot High Or Pivot Low

float ph = ta.pivothigh( close , prd, prd)

float pl = ta.pivotlow( close , prd, prd)

float ph1 = ta.pivothigh( high, prd, prd)

float pl1 = ta.pivotlow( low, prd, prd)

plotshape(ph and showpivot, text='H', style=shape.labeldown, color=color.new(color.white, 100), textcolor=color.new(color.red, 0), location=location.abovebar, offset=-prd)

plotshape(pl and showpivot, text='L', style=shape.labelup, color=color.new(color.white, 100), textcolor=color.new(color.lime, 0), location=location.belowbar, offset=-prd)

// keep values and positions of Pivot Highs/Lows in the arrays

var int maxarraysize = 20

var ph_positions = array.new_int(maxarraysize, 0)

var pl_positions = array.new_int(maxarraysize, 0)

var ph_vals = array.new_float(maxarraysize, 0.)

var pl_vals = array.new_float(maxarraysize, 0.)

var ph1_positions = array.new_int(maxarraysize, 0)

var pl1_positions = array.new_int(maxarraysize, 0)

var ph1_vals = array.new_float(maxarraysize, 0.)

var pl1_vals = array.new_float(maxarraysize, 0.)

// add PHs to the array

if ph

array.unshift(ph_positions, bar_index)

array.unshift(ph_vals, ph)

if array.size(ph_positions) > maxarraysize

array.pop(ph_positions)

array.pop(ph_vals)

// add PLs to the array

if pl

array.unshift(pl_positions, bar_index)

array.unshift(pl_vals, pl)

if array.size(pl_positions) > maxarraysize

array.pop(pl_positions)

array.pop(pl_vals)

if ph1

array.unshift(ph1_positions, bar_index)

array.unshift(ph1_vals, ph1)

if array.size(ph1_positions) > maxarraysize

array.pop(ph1_positions)

array.pop(ph1_vals)

// add PLs to the array

if pl1

array.unshift(pl1_positions, bar_index)

array.unshift(pl1_vals, pl1)

if array.size(pl1_positions) > maxarraysize

array.pop(pl1_positions)

array.pop(pl1_vals)

// functions to check Regular Divergences and Hidden Divergences

// function to check positive regular or negative hidden divergence

// cond == 1 => positive_regular, cond == 2=> negative_hidden

positive_regular_positive_hidden_divergence(src, cond) =>

divlen = 0

// prsc = source == 'Close' ? close : low

// prsc1 = source == 'High/Low' ? close : close

// if indicators higher than last value and close price is higher than las close

if dontconfirm or src > src[1] or close > close[1]
startpoint = dontconfirm ? 0 : 1 // don't check last candle

// we search last 15 PPs

for x = 0 to maxpp - 1 by 1

len = bar_index - array.get(pl_positions, x) + prd

len1 = bar_index - array.get(pl1_positions, x) + prd

// if we reach non valued array element or arrived 101. or previous bars then we don't search more

if array.get(pl_positions, x) == 0 or len > maxbars or array.get(pl1_positions, x) == 0 or len1 > maxbars

break

if len > 5 and

(cond == 1 and src[startpoint] > src[len] and (close[startpoint] < nz(array.get(pl_vals, x)) )) or

(cond == 2 and src[startpoint] < src[len] and (close[startpoint] > nz(array.get(pl_vals, x)) ))

slope1 = (src[startpoint] - src[len]) / (len - startpoint)

virtual_line1 = src[startpoint] - slope1

slope2 = (close[startpoint] - close[len]) / (len - startpoint)

virtual_line2 = close[startpoint] - slope2

arrived = true

for y = 1 + startpoint to len - 1 by 1

if src[y] < virtual_line1 or nz(close[y]) < virtual_line2

arrived := false

break

virtual_line1 -= slope1

virtual_line2 -= slope2

virtual_line2

if arrived

divlen := len

break

else if len1 > 5 and

(cond == 1 and src[startpoint] > src[len1] and ( low[startpoint] < nz(array.get(pl1_vals, x)))) or

(cond == 2 and src[startpoint] < src[len1] and ( low[startpoint] > nz(array.get(pl1_vals, x))))

slope1 = (src[startpoint] - src[len1]) / (len1 - startpoint)

virtual_line1 = src[startpoint] - slope1

slope2 = (close[startpoint] - close[len1]) / (len1 - startpoint)

virtual_line2 = close[startpoint] - slope2

arrived = true

for y = 1 + startpoint to len - 1 by 1

if src[y] < virtual_line1 or nz(close[y]) < virtual_line2

arrived := false

break

virtual_line1 -= slope1

virtual_line2 -= slope2

virtual_line2

if arrived

divlen := len1

break

divlen

// function to check negative regular or positive hidden divergence

// cond == 1 => negative_regular, cond == 2=> positive_hidden

negative_regular_negative_hidden_divergence(src, cond) =>

divlen = 0

// prsc = source == 'Close' ? close : high

// prsc1 = source == 'High/Low' ? close : close

// if indicators higher than last value and close price is higher than las close

if dontconfirm or src < src[1] or close < close[1]
startpoint = dontconfirm ? 0 : 1 // don't check last candle

// we search last 15 PPs

for x = 0 to maxpp - 1 by 1

len = bar_index - array.get(ph_positions, x) + prd

len1 = bar_index - array.get(ph1_positions, x) + prd

// if we reach non valued array element or arrived 101. or previous bars then we don't search more

if array.get(ph_positions, x) == 0 or len > maxbars or array.get(ph1_positions, x) == 0 or len1 > maxbars

break

if len > 5 and

(cond == 1 and src[startpoint] < src[len] and (close[startpoint] > nz(array.get(ph_vals, x)) )) or

(cond == 2 and src[startpoint] > src[len] and (close[startpoint] < nz(array.get(ph_vals, x)) ))

slope1 = (src[startpoint] - src[len]) / (len - startpoint)

virtual_line1 = src[startpoint] - slope1

slope2 = (close[startpoint] - nz(close[len])) / (len - startpoint)

virtual_line2 = close[startpoint] - slope2

arrived = true

for y = 1 + startpoint to len - 1 by 1

if src[y] > virtual_line1 or nz(close[y]) > virtual_line2

arrived := false

break

virtual_line1 -= slope1

virtual_line2 -= slope2

virtual_line2

if arrived

divlen := len

break

else if len1 > 5 and

(cond == 1 and src[startpoint] < src[len1] and ( high[startpoint] > nz(array.get(ph1_vals, x)))) or

(cond == 2 and src[startpoint] > src[len1] and ( high[startpoint] < nz(array.get(ph1_vals, x))))

slope1 = (src[startpoint] - src[len1]) / (len1 - startpoint)

virtual_line1 = src[startpoint] - slope1

slope2 = (close[startpoint] - nz(close[len1])) / (len1 - startpoint)

virtual_line2 = close[startpoint] - slope2

arrived = true

for y = 1 + startpoint to len1 - 1 by 1

if src[y] > virtual_line1 or nz(close[y]) > virtual_line2

arrived := false

break

virtual_line1 -= slope1

virtual_line2 -= slope2

virtual_line2

if arrived

divlen := len1

break

divlen

// calculate 4 types of divergence if enabled in the options and return divergences in an array

calculate_divs(cond, indicator_1) =>

divs = array.new_int(4, 0)

array.set(divs, 0, cond and (searchdiv == 'Regular' or searchdiv == 'Regular/Hidden') ? positive_regular_positive_hidden_divergence(indicator_1, 1) : 0)

array.set(divs, 1, cond and (searchdiv == 'Regular' or searchdiv == 'Regular/Hidden') ? negative_regular_negative_hidden_divergence(indicator_1, 1) : 0)

array.set(divs, 2, cond and (searchdiv == 'Hidden' or searchdiv == 'Regular/Hidden') ? positive_regular_positive_hidden_divergence(indicator_1, 2) : 0)

array.set(divs, 3, cond and (searchdiv == 'Hidden' or searchdiv == 'Regular/Hidden') ? negative_regular_negative_hidden_divergence(indicator_1, 2) : 0)

divs

// array to keep all divergences

var all_divergences = array.new_int(44) // 11 indicators * 4 divergence = 44 elements

// set related array elements

array_set_divs(div_pointer,index) =>

for x = 0 to 3 by 1

array.set(all_divergences, index * 4 + x, array.get(div_pointer, x))

// set divergences array

array_set_divs(calculate_divs(calcrsi, rsi),2)

// check minimum number of divergence, if less than showlimit then delete all divergence

// total_div = 0

// for x = 0 to array.size(all_divergences) - 1 by 1

// total_div += math.round(math.sign(array.get(all_divergences, x)))

// total_div

// if total_div < showlimit

// array.fill(all_divergences, 0)

// keep line in an array

var pos_div_lines = array.new_line(0)

var neg_div_lines = array.new_line(0)

var pos_div_labels = array.new_label(0)

var neg_div_labels = array.new_label(0)

// remove old lines and labels if showlast option is enabled

delete_old_pos_div_lines() =>

if array.size(pos_div_lines) > 0

for j = 0 to array.size(pos_div_lines) - 1 by 1

line.delete(array.get(pos_div_lines, j))

array.clear(pos_div_lines)

delete_old_neg_div_lines() =>

if array.size(neg_div_lines) > 0

for j = 0 to array.size(neg_div_lines) - 1 by 1

line.delete(array.get(neg_div_lines, j))

array.clear(neg_div_lines)

delete_old_pos_div_labels() =>

if array.size(pos_div_labels) > 0

for j = 0 to array.size(pos_div_labels) - 1 by 1

label.delete(array.get(pos_div_labels, j))

array.clear(pos_div_labels)

delete_old_neg_div_labels() =>

if array.size(neg_div_labels) > 0

for j = 0 to array.size(neg_div_labels) - 1 by 1

label.delete(array.get(neg_div_labels, j))

array.clear(neg_div_labels)

// delete last creted lines and labels until we met new PH/PV

delete_last_pos_div_lines_label(n) =>

if n > 0 and array.size(pos_div_lines) >= n

asz = array.size(pos_div_lines)

for j = 1 to n by 1

line.delete(array.get(pos_div_lines, asz - j))

array.pop(pos_div_lines)

if array.size(pos_div_labels) > 0

label.delete(array.get(pos_div_labels, array.size(pos_div_labels) - 1))

array.pop(pos_div_labels)

delete_last_neg_div_lines_label(n) =>

if n > 0 and array.size(neg_div_lines) >= n

asz = array.size(neg_div_lines)

for j = 1 to n by 1

line.delete(array.get(neg_div_lines, asz - j))

array.pop(neg_div_lines)

if array.size(neg_div_labels) > 0

label.delete(array.get(neg_div_labels, array.size(neg_div_labels) - 1))

array.pop(neg_div_labels)

// variables for Alerts

pos_reg_div_detected = false

neg_reg_div_detected = false

pos_hid_div_detected = false

neg_hid_div_detected = false

// to remove lines/labels until we met new // PH/PL

var last_pos_div_lines = 0

var last_neg_div_lines = 0

var remove_last_pos_divs = false

var remove_last_neg_divs = false

if pl or pl1

remove_last_pos_divs := false

last_pos_div_lines := 0

last_pos_div_lines

if ph or ph1

remove_last_neg_divs := false

last_neg_div_lines := 0

last_neg_div_lines

// draw divergences lines and labels

divergence_text_top = ''

divergence_text_bottom = ''

distances = array.new_int(0)

dnumdiv_top = 0

dnumdiv_bottom = 0

top_label_col = color.white

bottom_label_col = color.white

old_pos_divs_can_be_removed = true

old_neg_divs_can_be_removed = true

startpoint = dontconfirm ? 0 : 1 // used for don't confirm option

for x = 0 to 10 by 1

div_type = -1

for y = 0 to 3 by 1

endpoint = array.get(all_divergences, x * 4 + y)

if endpoint > 0 // any divergence?

div_type := y

if y % 2 == 1

dnumdiv_top += 1

top_label_col := array.get(div_colors, y)

top_label_col

if y % 2 == 0

dnumdiv_bottom += 1

bottom_label_col := array.get(div_colors, y)

bottom_label_col

if not array.includes(distances, endpoint) // line not exist ?

array.push(distances, endpoint)

new_line = showlines ?

line.new(x1=bar_index - endpoint,

y1= y % 2 == 0 ? low[endpoint] : high[endpoint],

x2=bar_index - startpoint,

y2= y % 2 == 0 ? low[startpoint] : high[startpoint],

color=array.get(div_colors, y), style=y < 2 ? reg_div_l_style : hid_div_l_style, width=y < 2 ? reg_div_l_width : hid_div_l_width) : na

if y % 2 == 0

if old_pos_divs_can_be_removed

old_pos_divs_can_be_removed := false

if not showlast and remove_last_pos_divs

delete_last_pos_div_lines_label(last_pos_div_lines)

last_pos_div_lines := 0

last_pos_div_lines

if showlast

delete_old_pos_div_lines()

array.push(pos_div_lines, new_line)

last_pos_div_lines += 1

remove_last_pos_divs := true

remove_last_pos_divs

if y % 2 == 1

if old_neg_divs_can_be_removed

old_neg_divs_can_be_removed := false

if not showlast and remove_last_neg_divs

delete_last_neg_div_lines_label(last_neg_div_lines)

last_neg_div_lines := 0

last_neg_div_lines

if showlast

delete_old_neg_div_lines()

array.push(neg_div_lines, new_line)

last_neg_div_lines += 1

remove_last_neg_divs := true

remove_last_neg_divs

// set variables for alerts

if y == 0

pos_reg_div_detected := true

pos_reg_div_detected

if y == 1

neg_reg_div_detected := true

neg_reg_div_detected

if y == 2

pos_hid_div_detected := true

pos_hid_div_detected

if y == 3

neg_hid_div_detected := true

neg_hid_div_detected

// get text for labels

// if div_type >= 0

// divergence_text_top := (div_type % 2 == 1 ? showindis != 'Don\'t Show' ? array.get(indicators_name, x) + '\n' : '' : '')

// divergence_text_bottom := (div_type % 2 == 0 ? showindis != 'Don\'t Show' ? array.get(indicators_name, x) + '\n' : '' : '')

// divergence_text_bottom

HDN=input.bool(true,"HD- Alert")

RDN=input.bool(true,"RD- Alert")

HDP=input.bool(true,"HD+ Alert")

RDP=input.bool(true,"RD+ Alert")

var divergence_text = ''

// draw labels

if showindis != 'Don\'t Show'

if dnumdiv_top > 0

divergence_text_top += str.tostring(dnumdiv_top)

divergence_text_top

if dnumdiv_bottom > 0

divergence_text_bottom += str.tostring(dnumdiv_bottom)

divergence_text_bottom

if divergence_text_top != ''

if showlast

delete_old_neg_div_labels()

divergence_text := top_label_col == neg_hid_div_col ? 'HD-' : top_label_col == neg_reg_div_col ? 'RD-' : ''

array.push(neg_div_labels, label.new(x=bar_index, y=math.max(high, high[1]), yloc=bottom_label_col == neg_reg_div_col?yloc.price:yloc.abovebar ,text=divergence_text, color=top_label_col, textcolor=neg_div_text_col, style=label.style_label_down))

if top_label_col == neg_hid_div_col and HDN

alert("Symbol : "+syminfo.ticker+"\nTimeframe : "+timeframe.period+"\nDivergance Type : HD-")

if top_label_col == neg_reg_div_col and RDN

alert("Symbol : "+syminfo.ticker+"\nTimeframe : "+timeframe.period+"\nDivergance Type : RD-")

if divergence_text_bottom != ''

if showlast

delete_old_pos_div_labels()

divergence_text := bottom_label_col == pos_hid_div_col ? 'HD+' : bottom_label_col == pos_reg_div_col ? 'RD+' : ''

array.push(pos_div_labels, label.new(x=bar_index, y=math.min(low, low[1]), yloc=bottom_label_col == pos_reg_div_col?yloc.price:yloc.belowbar,text=divergence_text, color=bottom_label_col, textcolor=pos_div_text_col, style=label.style_label_up))

if top_label_col == pos_hid_div_col and HDP

alert("Symbol : "+syminfo.ticker+"\nTimeframe : "+timeframe.period+"\nDivergance Type : HD+")

if top_label_col == pos_reg_div_col and RDP

alert("Symbol : "+syminfo.ticker+"\nTimeframe : "+timeframe.period+"\nDivergance Type : RD+")
برای استفاده از این اندیکاتور وارد حساب تریدینگویو خود شوید. از پایین سمت چپ منو Pine Editor را باز کنید و کل متن این فایل را Copy و در پاینادیتور Paste کنید. سپس از دکمه Save اندیکاتور را با نام دلخواه ذخیره کنید. اکنون در قسمت اندیکاتورهای تریدینگویو و قسمت My Scripts میتوانید آن را بر روی چارت بیندازید.

 اضافه کردن اندیکاتور به چارت و تهیه اشتراک رایگان الگوریتم استراتژیک معاملاتی
 بهترین مانیتورهای ترید (معرفی 7 مانیتور ترید)
 پرایس اکشن آل بروکس چیست؟ + مزایا
 بازکردن معامله در بایننس با کمک تریدینگ ویو
 چگونه در تریدینگ ویو ثبت نام کنیم؟
  اندیکاتور اتوماتیک تشخیص خطوط حمایت و مقاومت
 اندیکاتور اتوماتیک تشخیص روند صعودی و نزولی
سلام
اندیکاتور مورد نظر کجاست؟!!!!
ویدئوی آموزشی مرتبط هم که نیست
ممنون میشم پاسخ بدید 🌹🙏
سلام دوست عزیز، لینک اندیکاتور در متن مقاله قرار داده شده است. و همچنین ویدیوی کار با اندیکاتور در همین صفحه قرار دارد. لطفا مقاله را به صورت کامل مطالعه کنید.